Position is the most powerful visual variable in graphics because it leverages our innate spatial reasoning, making complex data instantly intuitive and easy to interpret.
Book: Semiology of Graphics
In Semiology of Graphics, Jacques Bertin identified a set of visual variables, such as position, size, shape, orientation, color, and texture, that are fundamental in the graphical representation of data. These variables serve as the building blocks for encoding information in visualizations.
Among them, position stands out as the most powerful.
Why? Because, unlike other variables that require interpretation or legends, position leverages our innate spatial reasoning. You don't need to explain what up and right mean on a scatterplot. People just get it.
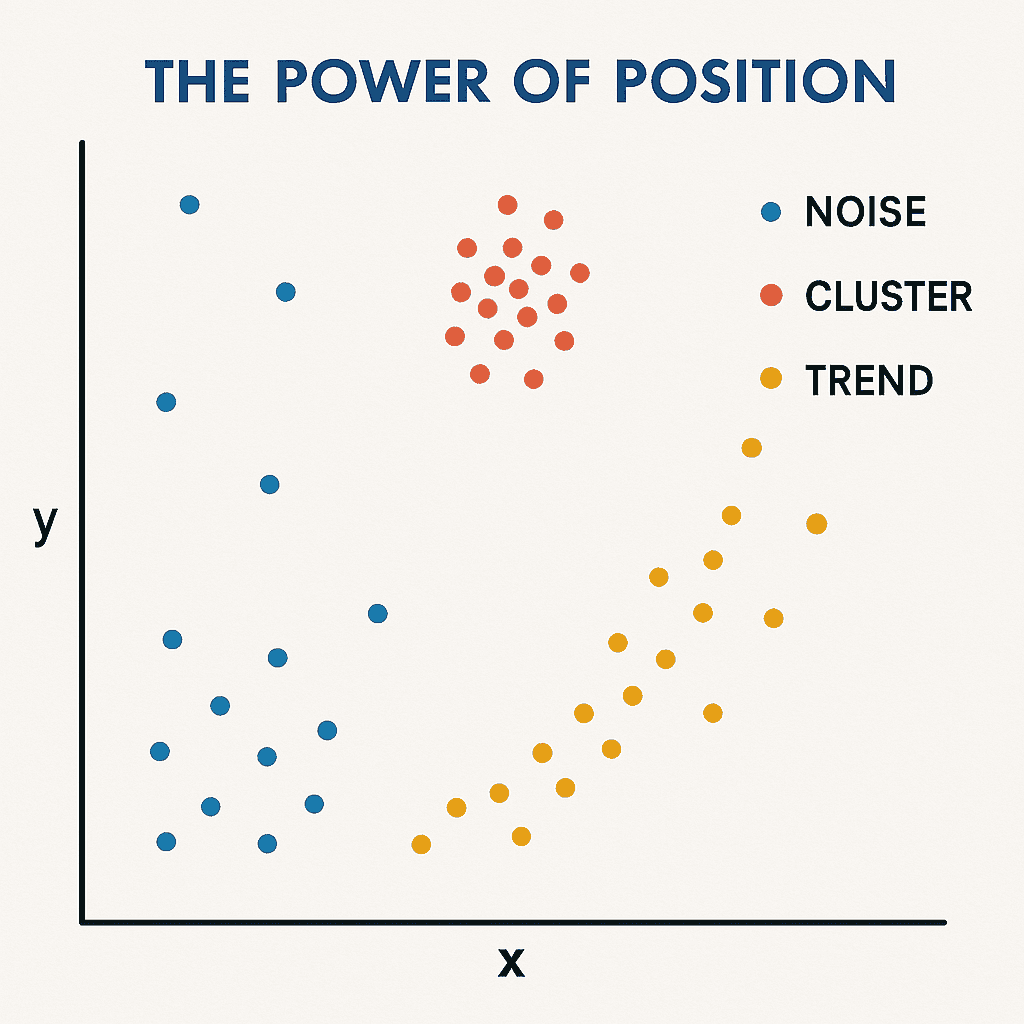
Position lets us recognize patterns effortlessly. It's what makes scatter plots so intuitive. You can spot clusters, correlations, and outliers in an instant.
On a map, a symbol's position directly corresponds to a real place, making spatial distribution instantly readable.
Bertin describes position as both selective and associative. It helps us isolate points of interest while grouping them together meaningfully.
Therefore, if you want to communicate information clearly and quickly, don't just think about what to show. Think about where to show it.